HDI - Implementing Customer Service Management
12.1 Overview
12.1.1 Description
The goal of Customer Satisfaction Measurement (CSM) is to collect, process and analyze customer feedback. CSM is used to gather:
- incident-based measurements
- periodic measurements
- spontaneous feedback.
|
This chapter will discuss customer satisfaction measurement from an IT Service Management perspective, but all of the principles apply to a Support Center environment as well. Customer feedback is essential for the whole service and support management process. Customer satisfaction is the ultimate measurement of success in service. Users are typically captive, and therefore have no other service option. Without customer satisfaction measurement capabilities in place, it is impossible to know how the whole process is performing since defections do not occur.
In ITIL terminology, customers and users have different roles. While both represent customers, a customer is a person who negotiates the Service Level Agreement and a user is a person who actually uses the service. Both groups are important in the CSM process. CSM can be best used to measure the whole process, not just some part of it. The Support Center plays a major role in overall service to the user. From the user point of view, it is difficult to separate the Support Center from the overall enterprise or IT organization. The Support Center is often the only human contact for the user and users tend to blame the desk for all IT errors.
While the CSM process is not measuring solely IT service or Incident Management, the Support Center is the single point of contact (SPOC) for the users, and it is clear that the Support Center Manager must be involved in the CSM process.
It is recommended that periodic surveys are used to measure overall satisfaction to IT Services and these periodic surveys can be a sub-process of Service Level Management. Incident based measurements are usually the best tool for measuring the Incident Management process and Support Center services. In some cases, it may be necessary to conduct periodic measurement on only the Support Center.

12.1.2 Relationships to other processes
CSM is related to Service Level Management, Incident Management and the overall Service Desk/Support Center function.

12.1.3 Key inputs and outputs to the process
The following chart shows key inputs and outputs to the CSM process.
| Description | Source | Importance
|
| INPUTS
|
| Spontaneous Feedback | User
| Medium
|
| Spontaneous Feedback | Customer
| High
|
| Response to Incident Survey |
User | Low
|
| Response to Periodic Survey |
User | Low
|
| Response to Periodic Survey
|
Customer | Medium
|
| OUTPUTS
|
| Spontaneous Feedback Reports |
Support Center Manager | Medium
|
| Spontaneous Feedback Reports |
Service Level Management | High
|
| Incident Survey Report |
Support Center Manager | High
|
| Incident Survey Report |
Support Center Manager | High
|
| Action Items |
Support Center Manager | High
|
12.1.4 Possible problems and issues
Possible problems
Too many surveys: it is important that IT Service Management coordinates all surveys through the CSM process in order to avoid overloading the customers and users with surveys from potentially multiple service providers. The respondent can become confused about what service is being measured in the various surveys and `survey burnout' can occur. Respondents may complete a survey only when they have a complaint.
Service not recognized: customers may have difficulties in recognizing an embedded service. IT service may be seen as an integrated component of an application or a network service. In such situations it is important to work in close cooperation with the other service providers to create a CSM process that provides useful information to all providers.
Quality issues
- Low response rate: low response rate may indicate bad survey instrument design, low recognition, lack of interest, or survey burnout. It leads to low quality in reports because the statistical accuracy of the results is lower. The response rate should be at least 35% of the sample selected. The reasons for a low response rate must be investigated.
- Unreliable results: a poor instrument design may also lead to another type of error. If the question phrasing is poor, then the instrument may not measure what its creators intended it to measure. This is perhaps the most dangerous type of error since the survey manager may be blind to it. Thus, rigorous instrument design is essential.
- Input error: statistical data is vulnerable to input errors. A typical case might be where a customer on a scale of 1-10 inputs 99 instead of 9. In a group of 100 answers this error increases the average with 0.9, which is a significant amount.
It is good practice to avoid scales with two digits and the input can be limited to allow only valid choices. In all cases you should check minimum and maximum values before reporting the results.
![[To top of Page]](../images/up.gif)
12.2 - Implementation
12.2.1 Support Center Manager's role
Responsibilities and activities
The Support Center Manager is responsible for incident based feedback and spontaneous feedback. Both processes are closely related to the Incident Management process.
The Support Center Manager can also be responsible for a part of the periodic survey process.
Deliverables
- Survey instrument design
- Sampling plans
- Spontaneous feedback management process
- Incident based feedback process
- Tool selection
- Training staff for handling spontaneous feedback
- Model reports
Competencies
- The ability to design survey instruments
- The ability to analyze results
- Good understanding of customers' business needs
Key performance indicators (KPIs)
- Response rate
- Comments on the instrument - independent of the survey or on the survey instrument if hardcopy
- Lack of errors
- Management feedback on reports
Other key roles and functions in the implementation process
- Customer satisfaction process owner
12.2.2 Planning for implementation Steps to take
- Ensure executive management support
- Create project plan
- Define customers of interest for survey process
- Define services to be surveyed
- Design surveys instrument and interview questionnaire
- Design process
- Select survey administration tool
- Make a pilot survey
- Train appropriate staff on survey administration and response processing
- Define reports
Groups to contact
- Service management
- Service level management
- Customers
- Users
Necessary information and data
- Customer contracts
- Service level agreements
- Customer and user contact information
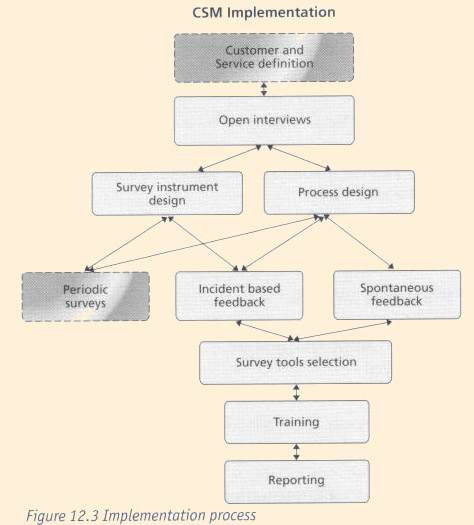
12.2.3 Implementing key process activities: hints and tips What to implement first
It is best to start with interviews. These will be useful in identifying the questions to ask on the survey instrument and the interviews will generate useful, detailed information.
Things that always work
- Simple questions, open-ended questions
- Involve executive management. A message from the CEO or President will be given higher priority than a message from Department Manager
Little things that deliver big returns
First surveys usually identify some problems in the service delivery process. If these are promptly solved, customers will react very positively.
Little things that always get forgotten
It is easy to forget to inform the customer of the results, and subsequent action plans, which is critical to gaining credibility with the customer base for future surveys. It is also very easy to design a process that is too complex. Do not underestimate the amount of work to do a survey properly.
12.2.4 Key process activities
Step-by-step prescriptive implementation guidance for each activity
- Ensure executive management support: it is important that your executive management approves and supports this activity. Make sure that you have approval for the measurement process. A good indication is the permission to use the executives' name in the actual survey.
- Process design: the first part of implementation is the process design. A service matrix, based on the customer, needs to be defined first.
In the support environment, three types of customers can be recognized.
- Customer: A person that buys (negotiates) the service
- User: A person that uses the supported service
- Caller: A person that has personally contacted the support group, by phone, e-mail or other media.
Callers are easy to find, but a user who is not a caller can be hard to contact.
One of the key problems in support services is that the customers and the users may have different views on the service. The customer who negotiates the service levels can be under cost pressure and want the lowest cost option. This may mean that the users will be very unsatisfied with the service they are getting.
- Determine type of service.
What exactly is the service? Support is definitely a service but it is also a part of the service it supports. In a normal Support Center desk environment, there are three levels in the service concept:
- The support service - eg. One call or email to help desk
- The supported service - eg. E-mail service
- The whole organization - eg. IT services
These levels are interrelated in many ways. The experience of one service call can ultimately affect the way we see the whole organization. The way the organization manages the service will affect the customer and may or may not cause him/her problems with the service.
There are cases where one has to accept that the customers are those who contact the support and the service is what they get through the contact. For example; if the users or business units are very independent and use whatever technology they want, it will be quite impossible to take responsibility for their technology choices.
The matrix below shows that there are nine different views to the question of who the customer is and what the service is. Each view is relevant and will provide different information.
| Support | Service | Organization
|
| Customer | |
|
| User | |
|
| Caller | |
|
The actual process has three sub-processes of which the periodic survey process may be a SLM
sub-process but it is described here as well. These sub-processes are listed below:
- periodic surveys
- Incident based surveys
- spontaneous feedback.
- Periodic surveys: these are frequently called `relationship surveys' since they focus on the broad relationship between the respondent and the service organization.
Periodic surveys can be done one to four times a year. An annual survey can be enough if the environment is stable. Typically, an internal Support Center in a mature industry does not need more than one measurement per year. Consider doing multiple periodic surveys during a year with each survey focusing on different aspects of service.
Design simple and short surveys. Ten questions are easier to answer than a hundred questions.
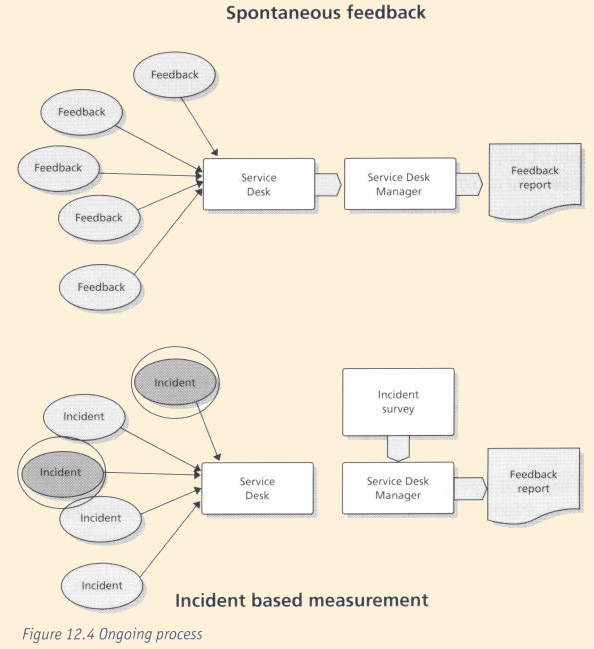
- Incident based feedback: this is linked directly to one single incident and thus is an excellent tool for monitoring the quality of service. The user/customer is contacted soon after the incident and is asked how well this particular incident was handled. The survey administration activity is quite similar to the period survey. It is important to make sure that the same person does not receive too many surveys. A reasonable rule of thumb is to not survey one person more than once every quarter - but you can always ask customers how often they are willing to be surveyed.
The Support Center Manager or a third party can make the contact, which can be a call, a hardcopy mailing, or an email.
This can be a continuous process or a regular activity. The form used should be very simple with no more than three to five questions.
- Spontaneous feedback: this is one type of incident. In this case a user gives feedback related to some service. This feedback is not different from the feedback that might be received as a response to an open question in a survey. The major difference is that that this feedback is given unsolicited. A user might point out that the new system is quite difficult to use or that they got poor service in a recent service request. The actual incident could be a problem with the system or a user error. The feedback must be sent to appropriate person/unit for processing when applicable.
It is important to train Support Center staff to be receptive to spontaneous feedback. As a SPOC, the Support Center receives most of the spontaneous feedback and is able to produce reports on it.
- Select a survey tool: there is a wide selection of survey design tools on the market. It is quite possible that your organization already has a tool for market research or other purposes. The tool should be easy and intuitive to use.
- Make a pilot survey: this is a test of the actual survey. Select a group of people to answer it, do not use help desk staff. The pilot may be just a small sample of the actual population or, if you are unsure, just a group of friends and colleagues in other departments etc. It can be a good idea to actually observe the respondents while he or she is answering the survey. Any problems that come out during the pilot must be analyzed and solved.
- Train appropriate staff on survey administration and response processing.: training will depend upon the selected method of surveying.
- Define reports: these should be simple and easy to understand. Remember that the goal is not to show off your report generating skills but to give people useful information, which can help them to change their behavior or make better decisions. Remember to use the actual scale in surveys (i.e if your actual scale was 1 to 5 use it in graphics. Excel may suggest something else; the scales tend to start from zero. Use simple graphs. A horizontal bar is a good representation of a satisfaction scale
12.2.5 Methods and techniques
Methods of asking
The main methods are interviews and forms. Forms can be paper or electronic. Some general rules follow.
Ask one question at a time. Do not ask questions like this:
When you are analyzing the applicability of the concepts brought forward here in the context of your environment, how do you like the length, content and style of this book so far?
Keep it simple. Ask one simple question: How do you like the content of this book?
Use open-ended questions. These are very useful. They are usually more valuable than the numbers. A typical pair of questions would be: Is there anything that we could do better?
Is there anything we have done very well?
The response to the first question will give a lot of valuable information but the response to the second one is valuable too. Your team will enjoy the positive feedback and it will point out your strengths. However, too many open-ended questions increase the respondent burden and the analyst's burden. Use them judiciously.
Interviews
A face-to-face interview is expensive but sometimes it is the only way to understand what the customers think. A face-to-face interview should contain mainly open questions. This requires that the person doing the interview understands the issues and can make intelligent, clarifying questions. Face-to-face interviews are a good instrument for a small group to gain an understanding of the field of inquiry to allow for better survey instrument design. Interviews can be very effective for a select group of particular unhappy customers or a select group of key business clients.
Interviews do not generate data that allows for statistical analysis and general statements about the population of interest. Also, the interviewer has to know how to ask follow-up probing questions.
It is essential to ask open questions in a customer satisfaction interview. A possible structure is this:
- What is important for you in this service?
- How is the Support Center doing in the areas you mentioned?
Just two questions will give you a lot of information. Do not argue with your customer even if they have opinions that seem to conflict objective reality. You may ask clarifying questions.
Generally, it would be best if the person conducting the interviews were an outsider who understands the issues. In many cases, consultants are used. If this is impossible, the manager can make these interviews. In some cases, even the staff could do some interviews. Naturally, this affects the reliability and the objectivity of the data. On the other hand, it can be a valuable learning experience for the staff and will help them to a better understanding.
Telephone interviews might be the only method available when customers are geographically dispersed. A telephone interview should be short.
Forms
A questionnaire is a non-interactive method. Of course, it is possible to build some intelligence in an electronic form but that is not true interaction.
In the Support Center environment, email is a good choice. The most common method is to do a web-form and send a link to it in email. You can also use old-fashioned letters. All methods have their strengths and weaknesses. Do not send survey forms as email attachments due to the fear of viruses in attachments. You can conduct forms based surveys also as interviews, either face to face or on telephone. This is in most cases unnecessary and a waste of resources. Interviews should be used for in-depth discussions.
Again, here are some basic rules:
- make the form simple and easy to understand (remember the Florida elections).
- do not use many different scales and do not crowd the questionnaire.
A simple example is shown below.
| Question | Dissatisfied to very satisfied
|
| How satisfied you were with the service overall | 1 | 2 | 3 | 4 | 5
|
| How satisfied you were with the speed of our service | 1 | 2 | 3 | 4 | 5
|
| How satisfied you were with the friendliness of our service | 1 | 2 | 3 | 4 | 5
|
Sampling
Sampling is a statistical method to estimate the characteristics of some populations. A representative random sample will give a good estimate and save a lot of work.
It is very important to understand the meaning of a representative random sample. It means that each unit in the population has an equal chance of becoming selected. A problem with simple random sample is that especially small groups can be over or under represented. In US political polls, the sample is carefully constructed to represent the whole USA. In the same way you can make sure that each department or site will have right representation.
Any non-random method of picking a sample can lead to bias. In the support world, one important source of bias is the customer/user attitude towards the Support Center. The customers have a choice and those who have called the Support Center have chosen it as their support channel. This means that all event-based surveys are biased and may give too positive results because of that.
Here is a simple method for choosing a random sample of 100 names from a population. Copy the names and addresses into an Excel sheet. Add important information like site or department names/numbers.
Calculate a random number for each name (Excel has a function, RAND, for doing this) Using the Paste Special function, copy the value of the numbers to another column called SELECT.
- Sort the names by SELECT.
- Pick the first 100 names.
In the example sheet below, the first three have been selected.
| Name | SELECT
|
| Graham Grey | 0.075
|
| Mary Brown | 0.144
|
| Barry White | 0.173
|
| John Doe | 0.198
|
| John Dark | 0.208
|
| Polly Pink | 0.438
|
| Francois Yellow | 0.442
|
| Tina Light | 0.756
|
| Stephen Mauve | 0.761
|
| Cilia Black | 0.901
|
By this method, your sample will be truly random.
If you want to have the sample to represent many departments, repeat the process for each department or subgroup.
12.2.6 Audits for effectiveness
Return rate
Return rate means the percentage of those who completed a questionnaire compared to those asked to respond to the questionnaire. Internal customers should have a good rate; external customers usually have a lower rate. Satisfied, loyal customers tend to feel it is their duty to answer.
A bad rate might indicate bad survey instrument design or improper administration practices. Here are some rules:
- do not send survey requests just before or after holidays
- make sure that your instructions are clear and that questions are easy to answer
- make sure that the respondents know who is sending the mail; it must not look like SPAM or junk mail
- tell respondents how long it will take to fill out the survey (this can be estimated in the pilot survey).
Customer satisfaction
There should be a clear cycle of recognized and solved problems. It is not possible to have continuously improved results in customer satisfaction surveys but recognized problems should vanish.
12.3 - Ongoing Operation
12.3.1 Support Center Manager's role
Responsibilities and activities
The Support Center Manager is responsible for the collection of spontaneous feedback. This is an ongoing process where the staff need to be trained and monitored. Unusual findings and serious customer issues must be reported promptly to IT Service Management.
Incident based measurements are collected regularly according to process design. Usually this means that a survey questionnaire is sent to a sample of users who have reported incidents. The responses are analyzed and presented to management.
Deliverables
- Spontaneous feedback report
- Incident based measurement report
Competencies required
- The ability to analyze survey data
- Project management skills
- MS Excel
KPIs
12.3.2 Support Center Function's role
- Responsibilities and activities
- To register spontaneous feedback
Deliverables
- To deliver readable and concise reports of user feedback
Competencies required
- Listening skills
- Writing skills
- Ability to brief peers and managers
KPIs
- Amount of feedback reported
12.4 - Optimization
12.4.1 - The optimization process
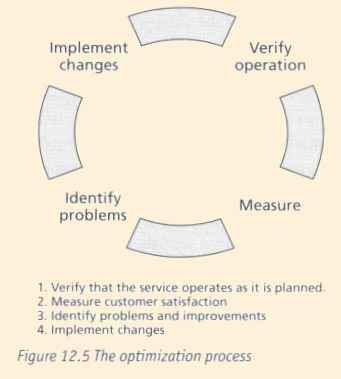
The customer satisfaction measurement process should lead to clear improvements. Reported problems should be corrected. As customer satisfaction is measured on a limited scale, it is not possible to have continuously improving results.
The process should be efficient and should not cause management overhead.
12.4.2 Support Center Manager's role
Responsibilities and activities
Monitor:
- the quality of written feedback reports
- response rates
- level of satisfaction
- repeating issues
- efficiency of process.
Deliverables
- Process design improvements
- Process management
KPIs
- Number of improvements which have resulted from CSM
- Cost of survey
12.4.3 Other key roles and functions in the optimization process
IT Service management must take an active role in CSM; reports must be taken seriously and resources must be allocated for fixing reported problems. If senior management is not interested in CSM results, there is very little need for the whole process.
12.4.4 Future impact of this process on the Support Center
A successful SLM process is essential for the future development for both the Support Center and overall IT Service Management. The Support Center Manager who speaks with the voice of the customer will be listened to more closely.
12.5 - Measurement, costing and management reporting
12.5.1 - Implementing: Benefits and Costs
Why implement this process and what can be gained
CSM is essential for successful ITSM. Without customer feedback, it is impossible to judge the overall quality of the process.
Cost elements for implementation
The design of the process is the major cost element. Professional help should be used. Also consider costs for tools for handling input, processing and reporting if necessary.
Making the business case to implement
Costs should be justified. The process is easy to design and implement but tools and automation are necessary if the volume of feedback is high.
12.5.2 Ongoing operations
Cost elements for ongoing operations
Data collection; this includes:
- the cost of the software used
- mailing cost
- interview costs
- customer time.
It is important not to forget customer time. This can be calculated as shown below.
| Formula for Annual Cost:
Number of users X number of surveys X (response rate X time to answer + (1-response rate) X time to discard survey) X cost per time unit
Here is an example:
20,000 employees receive quarterly an electronic survey form. 35 % answer and spend 5 minutes at it. 65% do not answer but spend 30 seconds discarding the survey. The cost of customer time would be $132.800 if one minute costs 80 cents: Annual Cost= 4 * 20.000((35*5min + 65*0,5 min)/100) * $.80 = $132.800 $
|
12.5.3 Tools
Implementation
There exist tools for survey instrument design; these can be useful particularly in web-surveys.
Ongoing operations
There are a variety of tools and services available for web-surveys.
Reporting
Excel is adequate in most cases but if you have multiple levels (departments/services) a more advanced tool can be useful. The tool should have capabilities for statistical analysis and adhoc reporting.
Annex Documents
Overview
Annex A12.1 - Checklist of required activities for CSM
The following checklists can be used to ensure that all required activities have been
undertaken for the implementation and ongoing Operations of CSM.
- implementing
- customer list
- current contact information
- correct addresses
- titles, job descriptions or roles
- services used
- service descriptions
- survey forms or emails
- Cover letter
- Preferably personalized letter with date of introduction
- service description
- reason for survey
- how and when to reply
- what the customer will get
- thanks
- signature
- survey questions
- Helpful for ongoing operations
- Schedule of future surveys and trends analysis
- follow up of actions taken
- return rate
