
| 1Introduction | 2Serv. Mgmt. | 3Principles | 4Strategy | 5Economics | 6Organization | 7Tactics/Operations | 8Considerations | 9Issues | AAppendeces |
| 4.1Define Market | 4.2Develop Offerings | 4.3Develop Strategic Assets | 4.4Prepare For Execution |
From the other perspective, service management is a competence for offering services as part of a business strategy. A software vendor may decide to offer software as a service. It combines its capabilities in software development with new capabilities in service management. It also makes use of its capabilities in maintaining software applications to bundle technical support as part of the core service. By adopting a service oriented approach supported by service management capabilities, the vendor has transformed itself into a service business. This approach has also been adopted by internal software engineering groups who have changed from being cost centres to being profit centres.
For example, the market leader in airline reservation systems originated from a successful internal computer based reservation system of a major airline. Such transformations require strong capabilities in marketing, finance, and operations.
 |
| Figure 4.1 Strategies for Services and Services for Strategies |
Organizations strive to achieve business objectives using whatever assets they have at hand, subject to various constraints. Constraints include costs and risks attributable to complexity, uncertainty and conflicts in the business environment. The value-creating potential of the business depends on the performance of business assets. Assets must perform well at their full potential. The assets may be owned by the business or available for use from others under various types of financial arrangements. More often than not such arrangements are agreements or contracts for services. Business managers are given the responsibility, authority, and resources necessary to deliver certain outcomes using the best possible means. Services are a means for managers to enable or enhance the performance of business assets leading to better outcomes. The value of a service is best measured in terms of the improvement in outcomes that can be attributed to the impact of the service on the performance of business assets. Some services increase the performance of customer assets, some services maintain performance, and yet others restore performance following adverse events. A major aspect of providing value is preventing or reducing the variation in the performance of customer assets.
In a trading system, for example, it is not enough for the service to feed the trading system with real-time market data. To minimize trading losses the data feed must be available without interruption during trading hours, and at as many trading desks necessary with a contingency system in place. An investment bank is therefore willing to pay a premium for a news-feed service providing a higher level of assurance than a service used by a competitor. The difference translates into greater trading gains.
Focus on customer assetsThe performance of customer assets should be a primary concern of service management professionals because without customer assets there is no basis for defining the value of a service. |

|
| Figure 4.2 Analyzing an outcome |
Customers own and operate configurations of assets to create value for their own customers. The assets are the means of achieving outcomes that enable or enhance value creation. For example, for a lending bank value is created by the outcome of processing a loan application on time (Figure 4.2). Customers receiving the loan will have access to the required financial capital and the lender benefits from the onset and accrual of interest. The lending process is therefore a business asset whose performance leads to specific business outcomes.
It is important for managers to gain deep insight into the businesses they serve or target. This includes identifying all the outcomes for eve customer and market space that falls within the scope of the particular strategy. For the sake of clarity, outcomes are classified and codified with reference tags that can be used in various contexts across the Service Lifecycle (Table 4.1).
| Category | Tag | Outcome statement |
| Enhanced capabilities | EC1 | Decision making and action in response to business events is faster |
| EC2 | Increase in knowledge, skills, and experience for business processes | |
| EC3 | Business processes are enhanced with superior logic | |
| EC4 | Industry best practices are available through application updates | |
| EC5 | Supply chain is extended | |
| EC6 | Availability of specialized knowledge and expertise | |
| Increased performance (IP) | IP1 | Increase in throughput of business processes |
| IP2 | Decrease in average collection period (accounts receivables) | |
| IP3 | Increase in return on assets | |
| IP4 | Increase in customer satisfaction | |
| Enhanced resources (ER) | ER1 | Resources are freed up for new opportunities |
| ER2 | Increase in productivity of staff | |
| ER3 | Increased flexibility in operations | |
| ER4 | Increase in available resources | |
| Reduced costs (RC) | RC1 | Decrease in fixed costs of business process |
| RC2 | Decrease in unit costs of employee benefits administration | |
| RT3 | Lower start-up time for new or expanded operations | |
| Reduced risks (RR) | RR1 | Decrease in operational risks from variation in performance of assets |
| RR2 | Decrease in operational risks from shortage in capacity of assets | |
| RR3 | Business continuity is assured. Passed audit. | |
| RR4 | Business processes are compliant with regulations | |
| Table 4.1 Example of a scheme to tag customer outcomes | ||
 |
| Figure 4.3 Customer outcomes are used to tag services and service assets |
Services and service assets are tagged with the customer outcomes they facilitate. This is a principle similar to the idea of tagging materials, components and sub-assemblies to the final products they are embedded in. The valuation of services and service asset becomes easier when it is possible to visualize the customer outcomes they facilitate. Mapping of customer outcomes to services and service assets can be accomplished as part of a Configuration Management System (CMS).
Gaining insight into the customer's business and having good knowledge of customer outcomes is essential to developing a strong business relationship with customers. Business Relationship Managers (BRMs) are responsible for this. They are 'customer focused' and manage opportunities through a Customer Portfolio.
In many organizations BRMs are known as Account Managers, Business Representatives, and Sales Managers. Internal IT Service Providers need this role to develop and be responsive to their internal market. They work closely with Product Managers who take responsibility for developing and managing services across the lifecycle. They are 'product-focused' and perceive the environment through a Service Portfolio.
An outcome-based definition of services ensures that managers plan and execute all aspects of service management entirely from the perspective of what is valuable to the customer. Such an approach ensures that services not only create value for customers but also capture value for the service provider.
 |
| Figure 4.4 Provider business models and customer assets |
Services differ primarily by how they create value and in what context. Service archetypes are like business models for services. They define how service providers act on behalf of customers to create value (Figure 4.4). Customer assets are the context in which value is created because they are linked to business outcomes that customers want. Customers own and operate different types of assets depending on several factors such as strategic industry factors, customers, competitors, business models, and strategy.
|
| Figure 4.5 Asset-based and Utility-based positioning |
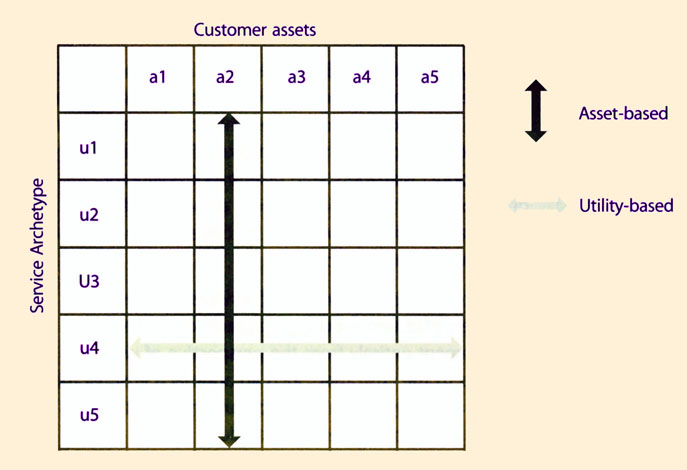
A combination of service archetype and customer ass: (Ux-Ay) represents an item in the Service Catalogue. Several services in a catalogue may belong to the same archetype or model (Ux). Many service archetypes may be combined with the same type of customer asset (Ay) under an asset-based service strategy. The same archetype may be used to serve different types of customer assets under a utility-based service strategy (Figure 4.5). This is a variation of need-based and access-based positioning. The strategy of the service provider will determine the contents of the Service Catalogue.
It is useful for managers to visualize services as value creating patterns made up of customer assets and service archetypes (Figure 4.6). Some combinations have more value for customers than others even though they may be made of similar asset types and archetypes. Services with closely matching patterns indicate opportunity for consolidation or packaging as shared services. If the Applications asset type appears in many patterns, then service providers can have more investments in capabilities and resources that support services related to Applications. Similarly, if many patterns include the Security archetype, it is an indication that security has emerged as a core capability. These are just simple examples of how the Service Catalogue can be visualized as a collection of useful patterns. Service strategy can result in a particular collection of patterns (intended strategy) or a collection of patterns can make a particular service strategy attractive (emergent strategy).
This visual method can be useful in communication and coordination between functions and processes of service management. These visualizations are the basis of more formal definitions of services. Proper matching of the value-creating context (customer assets) with the value creating concept (service archetype) can avoid shortfalls in performance. For example, the customer's business may involve reviewing and processing of application forms, requests, and account registrations.
Questions of the following type can be useful:
|
When services share market spaces they also tend to share capabilities, resources, costs, risks, challenges, opportunities etc. Services with high degree of overlap could be consolidated under the same operations. Variants of services have very high degree of overlap. Similar services can have the same core service package. |
| With respect to themselves | With respect to their customrs |
| Who are our service providers? | Who are their customers? |
| How do services create value for them? | How do they create value? |
| What assets do we deploy to provide value? | Which of their assets receive value? |
| Which assets should we invest in' | Which of our assets do they value most? |
| How should we deploy our assets? | How do they deploy their assets? |
| Table 4.2 Probing questions to gain insight | |
The preceding set of questions is an instance of a more generic set of probing questions that is useful to gain valuable insight into the customer's business (Table 4.2). These are not merely questions. When effectively applied, they are tools of incision used to dissect business outcomes that customers want services to support. They reveal not only challenges associated with a particular customer or business environment but also the opportunities.
![]()
4.2 Develop The Offerings
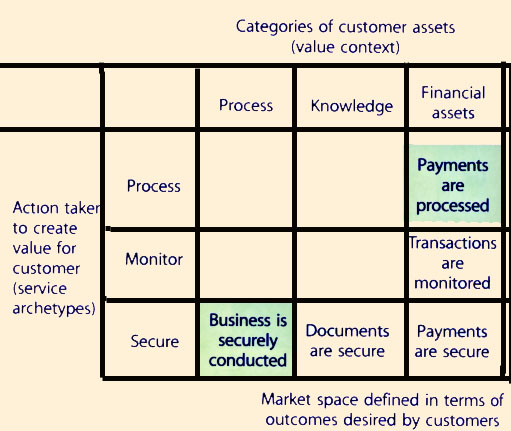
A market space is defined by a set of business outcomes, which can be facilitated by a service. The opportunity to facilitate those outcomes defines a market space. The following are examples of business outcomes that can be the bases of one or more market spaces.
Each of the conditions is related to one or more categories of customer assets, such as people, infrastructure, information, accounts receivables and purchase orders, and can then be linked to the services that make them possible. Each condition can be met through multiple ways (Figure 4.7). Customers will prefer the one that means lower costs and risks. Service providers create these conditions through the services they deliver and thereby provide support for customers to achieve specific business outcomes.
A market space therefore represents a set of opportunities for service providers to deliver value to a customer's business through one or more services. This approach h. definite value for service providers in building strong relationships with customers. Customers often express dissatisfaction with a service provider even when terms and conditions of service level agreements (SLAs) are fulfilled. Often it is not clear how services create value for customers. Services are often defined in the terms of resources made available for use by customers. Service definitions lack clarity on the context in which such resources are useful, and the business outcomes that justify the expense of a service from a customer's perspective. This problem leads to poor designs, ineffective operation and lacklustre performance in service contracts. Service improvements are difficult when it is m clear where improvements are truly required. Customers can understand and appreciate improvements only within the context of their own business assets, performances and outcomes. A proper definition of services takes into account the context in which customers perceive value from the services.
|
| Figure 4.7 Market spaces are defined by the outcome that customers desire |
Solutions that enable or enhance the performance of the customer assets indirectly support the achievement of the outcomes generated by those assets. Such solutions and propositions hold utility for the business. When that utility is backed by a suitable warranty customers are ready to buy.
| Services are a means of delivering value to customers by facilitating outcomes customers need to achieve without owning specific costs and risks. |
Well-formed service definitions lead to effective and efficient service management processes. Generic examples are given below:
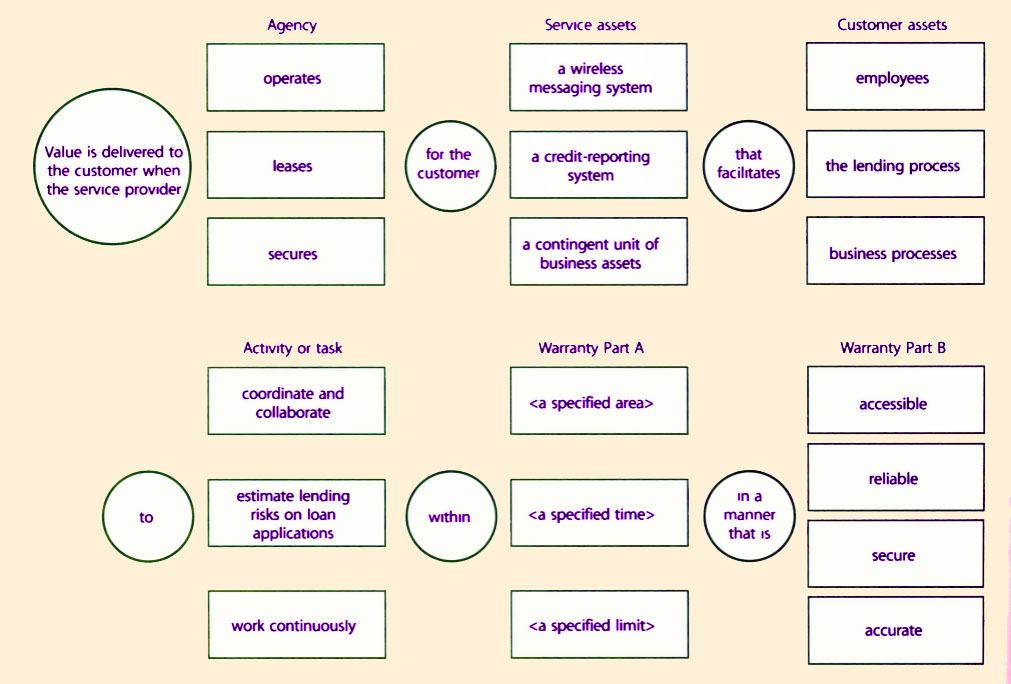
Service definitions are useful when they are broken down into discrete elements that can then be assigned to different groups, who will manage them in a coordinated manner to control the overall effect of delivering value to customers (Figure 4.8).

|
| Figure 4.8 Actionable components of service definitions in terms of utility |
 |
| Figure 4.9 Actionable components of service definitions in terms of warranty |
Well-constructed definitions make it easier to visualize patterns across Service Catalogues and portfolios that earlier were hidden due to unstructured definitions (Figure 4.9). Patterns bring clarity to decisions across the Service Lifecycle. Table 4.3 shows the type of questions that can guide analysis of service definitions to make them actionable.
| Service Type | Utility (Part A and B) |
| What services do we provide? Who are our customers? | What outcomes do we support? How do they create value for their customers? What constraints do our customers face? |
| Customer assets | Service assets |
| Which customer assets do we support? Who are the users of our services? | What assets do we deploy to provide value? How do we deploy our assets? |
| Activity or task | Warranty |
| What type of activity do we support? How do we track performance? | How do we create value for them? What assurances do we provide? |
| Table 4.3 Analysis of service definitions for action | |
Without the context in which the customers use services it is difficult to completely define value. Without complete definition of value, there cannot be complete production of value. As a result, outcomes are not fulfilled to the customer's satisfaction.
However, it is not to say that a service cannot be developed without a customer in hand. It simply means that the story of a service begins either with the needs of a specific customer or a category of customers (i.e. market space). Customer needs exist and are fulfilled independent of service providers or their services. However, value for a customer rests on not only fulfillment of these needs, but also how they are fulfilled, and often at what risks and costs. Certain services create value by preventing or recovering from undesirable conditions or states. In such cases customers may desire a change in the risks to which their assets may be exposed. In either case, the second order effect of services is that the changes they produce, or prevent, have a positive and usually measurable effect on the performance and outcomes of the customer's business.
These types of questions and others of a similar nature are crucial for an organization to consider in the implementation of a strategic approach to service management. They are applied by all types of service providers, internal and external. What changes is the context and meaning of certain ideas such as customers, contracts, competition, market spaces, revenue and strategy. In fact, these clarifying questions are particularly important for internal service providers who typically operate within the realm of an enterprise or government agency, have customers who are also owners, and whose strategic objectives may not always be clear.
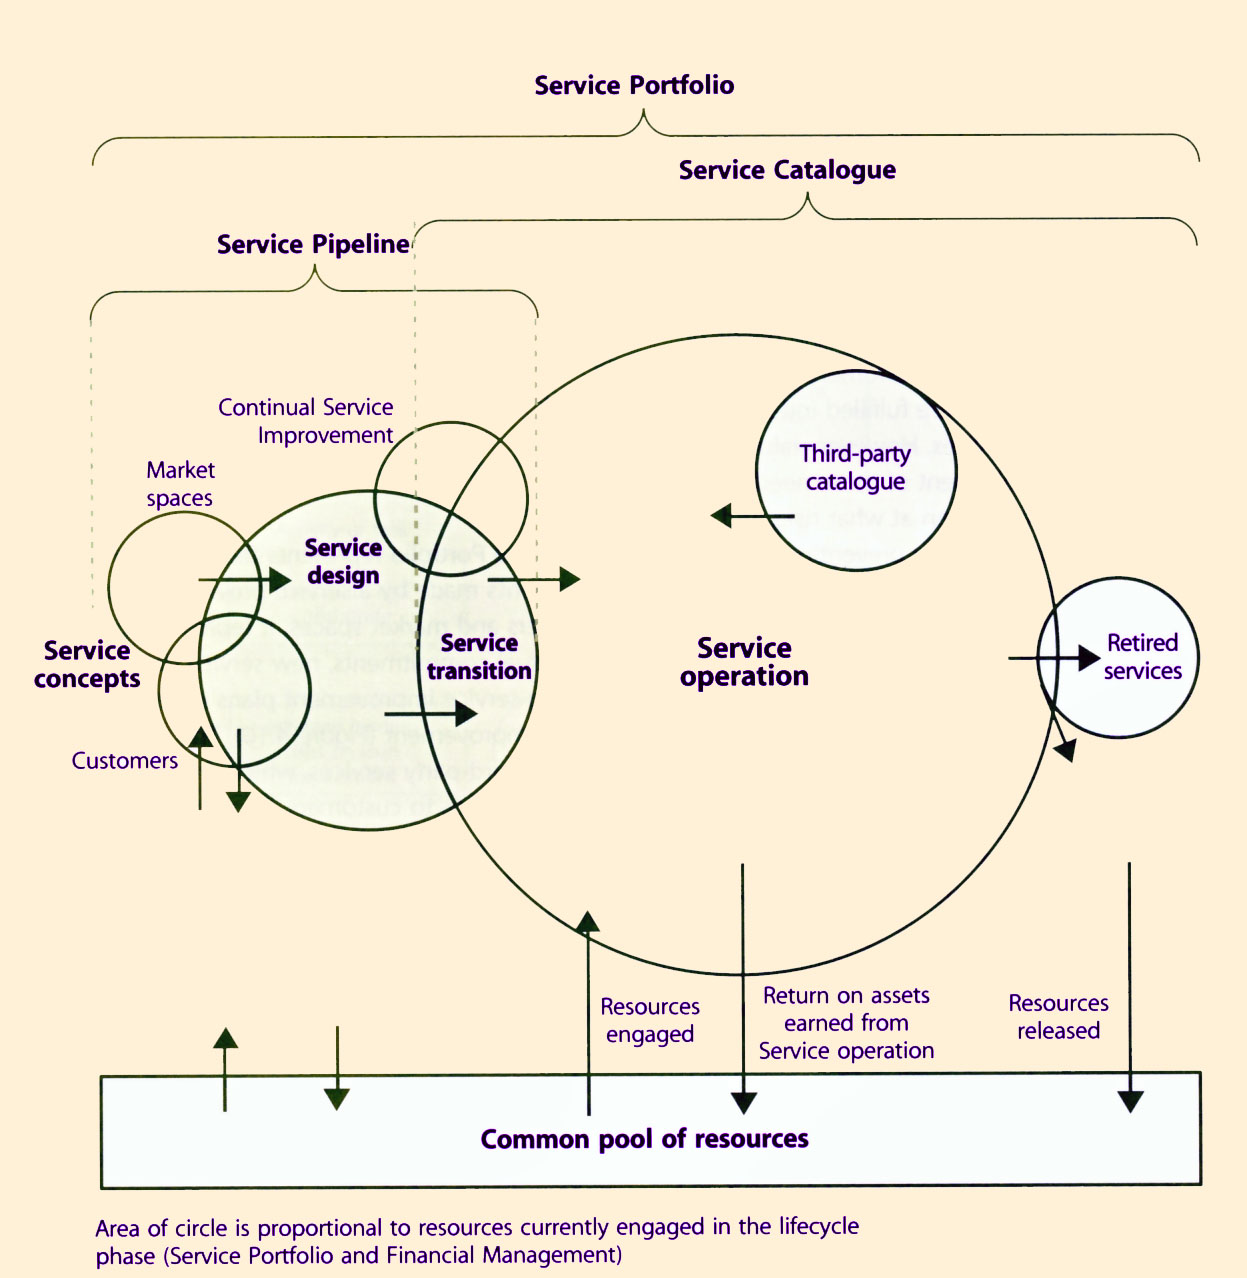
| The Service Portfolio represents the commitments and investments made by a service provider across all customers and market spaces. It represents present contractual commitments, new service development, and ongoing service improvement plans initiated by Continual Service Improvement (Figure 4.10). The portfolio also includes third-party services, which are an integral part of service offerings to customers. Some third-party services are visible to the customers while others are not. Chapter 5 provides further guidance on how to develop and manage portfolios. |
 |
| Figure 4.11 Service Pipeline and Service Catalogue |
The portfolio management approach helps managers prioritize investments and improve the allocation of resources. Changes to portfolios are governed by policies and procedures. Portfolios instil a certain financial discipline necessary to avoid making investments that will not yield value. Service Portfolios represent the ability and readiness of a service provider to serve customers and market spaces. The Service Portfolio is divided into three phases: Service Catalogue, Service Pipeline and Retired Services (Figure 4.11).
The Service Portfolio represents all the resources presently engaged or being released in various phases of the Service Lifecycle. Each phase requires resources for completion of projects, initiatives and contracts. This is a very important governance aspect of Service Portfolio Management (SPM).
Entry, progress and exit are approved only with approved funding and a financial plan for recovering costs or showing profit as necessary. The Portfolio should have the right mix of services in the pipeline and catalogue to secure the financial viability of the service provider. The Service Catalogue is the only part of the Portfolio that recovers costs or earns profits.
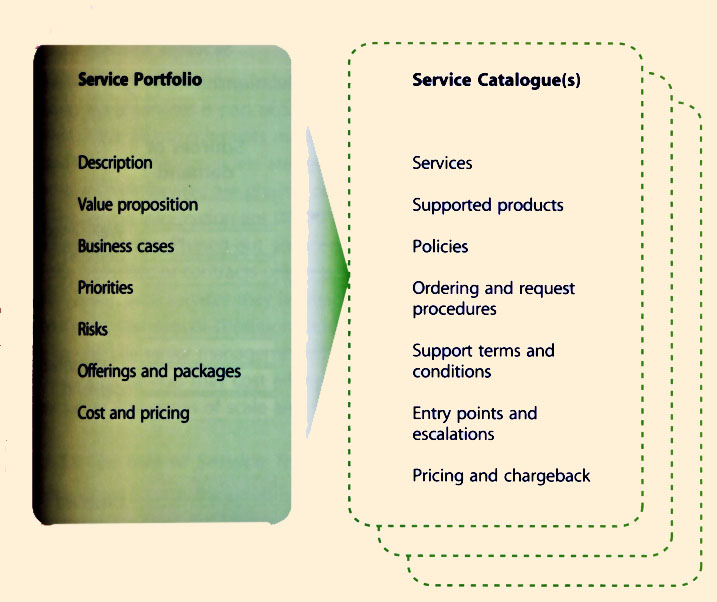
In summary, SPM is about maximizing value while managing risks and costs. The value realization is derived from better service delivery and customer experiences. Through SPM, managers are better able to understand quality requirements and related delivery costs. They can then seek to reduce costs through alternative means while maintaining service quality. The SPM journey begins with documenting the organization's standardized services, and as such has strong links to Service Level Management, particularly the Service Catalogue (Figure 4.12).
|
| Figure 4.12 Elements of a Service Portfolio and Service Catalogue |
The Catalogue is useful in developing suitable solutions for customers from one or more services. Items in the Catalogue can be configured and suitably priced to fulfill a particular need. The Service Catalogue is an important tool for Service Strategy because it is the virtual projection of the service provider's actual and present capabilities. Many customers are only interested in what the provider can commit now, rather than in future. The value of future possibilities is discounted in the present.
It serves as a service order and demand channelling mechanism. It communicates and defines the policies, guidelines and accountability required for SPM. It defines the criteria for what services fall under SPM and the objective of each service. It acts as the acquisition portal for customers, including pricing and service-level commitments, and the terms and conditions for service provisioning. It is in the Service Catalogue that services are decomposed into components; it is where assets, processes and systems are introduced with entry points and terms for their use and provisioning. As providers may have many customers or serve many businesses, there may be multiple Service Catalogues projected from the Service Portfolio. In other words, a Service Catalogue is an expression of the provider's operational capability within the context of a customer or market space.
The Service Catalogue is also a visualization tool for SPM decisions. It is in the catalogue that demand for services comes together with the capacity to fulfill it. Customer assets attached to a business outcome are sources of demand (Figure 4.13). In particular, they have expectations of utility and warranty. If any items in the catalogue can fulfill those expectations, a connection is made resulting in a service contract or agreement. Catalogue items are clustered into Lines of Service (LOS) based on common patterns of business activity (PBA) they can support.
LOS performing well are allocated additional resources to ensure continued performance and anticipate increases in demand for those services. Items performing above a financial threshold are deemed viable services. An effort is to be made to make them popular by introducing new attributes, new service level packages (SLP), improved matching with sources of demand, or by new pricing policies. If performance drops below a threshold, then they are marked for retirement. A new Service Transition project is initiated and a Transition Plan is drafted to phase out the service.
 |
| Figure 4.13 Service Catalogue and Demand Management |
A subset of the Service Catalogue may be third-party or outsourced services. These are services that are offered to customers with varying levels of value addition or combination with other Catalogue items. The Third-Party Catalogue may consist of core service packages (CSP) and SLP. It extends the range of the Service Catalogue in terms of customers and market spaces. Third-party services may be used to address underserved or unserved demand (Figure 4.13) until items in the Service Pipeline are phased into operation. They can also be used as a substitute for services being phased out of the Catalogue. Sourcing is not only an important strategic option but can also be an operational necessity. Section 6.5 provides more guidance on sourcing strategy.
Candidate suppliers of the Third-Party Catalogue may be evaluated using the eSourcing Capability Model for Service Providers (eSCM-SPTM) developed by Carnegie Mellon University.
|
There are instances in which certain business needs cannot be fulfilled with services from a catalogue. The service provider has to decide how to respond to such cases. The options are typically along the following lines:
|
|
| Figure 4.14 Growth and maturity of service management into a trusted asset |
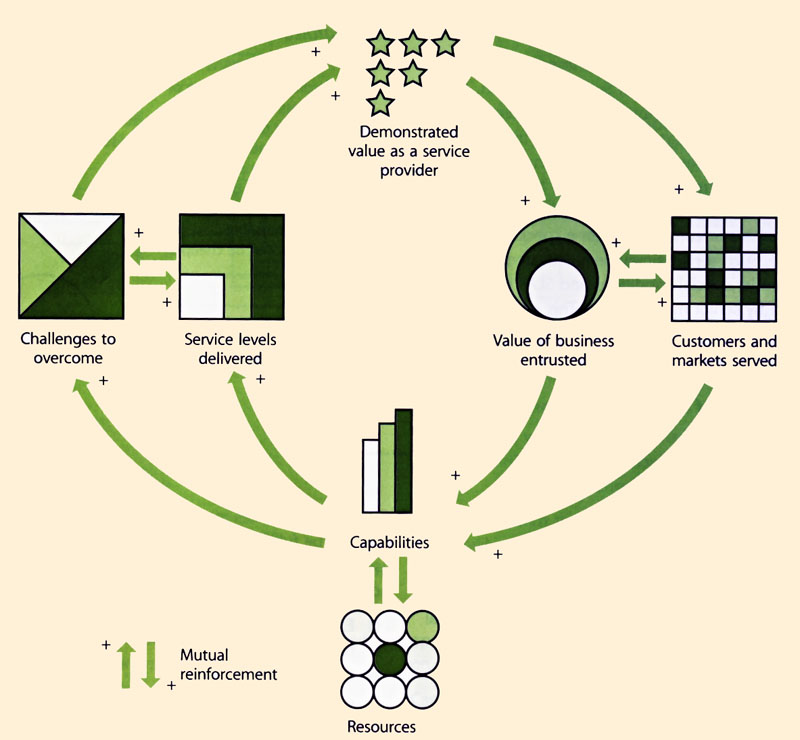
Customers perceive benefits in a continued relationship, and entrust the provider with the business of increasing value and also adding new customers and market spaces to the realm of possibilities. This justifies further investments in service management in terms of capabilities and resources, which have a tendency to reinforce each other.
Stakeholders may initially trust the provider with low-value contracts or non-critical services. Service management responds by delivering the performance expected of a strategic asset. The performance is rewarded with contra renewals, new services, and customers, which together represent a larger value of business. To handle this increase in value, service management must invest further in assets such as process, knowledge, people, applications and infrastructure. Successful learning and growth enable commitments of higher service levels as service management gets conditioned to handle bigger challenges.
 |
| Figure 4.15 Mutual welfare when service assets are engaged in supporting customer outcomes |
Value capture is an important notion for all types of service providers, internal and external. Good business sense discourages stakeholders from making major investments in any organizational capability unless it demonstrates value capture. Internal providers are encouraged to adopt this strategic perspective to continue as viable concerns within a business. Cost recovery is necessary but not sufficient. Profits or surpluses allow continued investments in service assets that have a direct impact on capabilities.
Linking value creation to value capture is a difficult but worthwhile endeavour. In simplest terms customers buy services as part of plans for achieving certain business outcomes. Say, for example, the use of a wireless messaging service allows the customer's sales staff to connect securely to the sales force automation system and complete critical tasks in the sales cycle. This has a positive impact on cash flows from payments brought forward in time. By linking purchase orders and invoices expedited from use of the wireless service it is possible to sense the impact of the service on business outcomes. They can be measured in terms such as Days Sales Outstanding (DSO) and average time of the Order-to-Cash cycle. The total cost of utilizing the service can then be weighed against the impact on business outcomes.
It is difficult to establish the cause-and-effect relationship between the use of the service and the changes in cash flows. Quite often, there are several degrees of separation between the utilization of the service and the benefits customers ultimately realize. While absolute certainty is difficult to achieve, decision making nevertheless improves.
|
| Figure 4.16 Service management as a closed-loop control system |
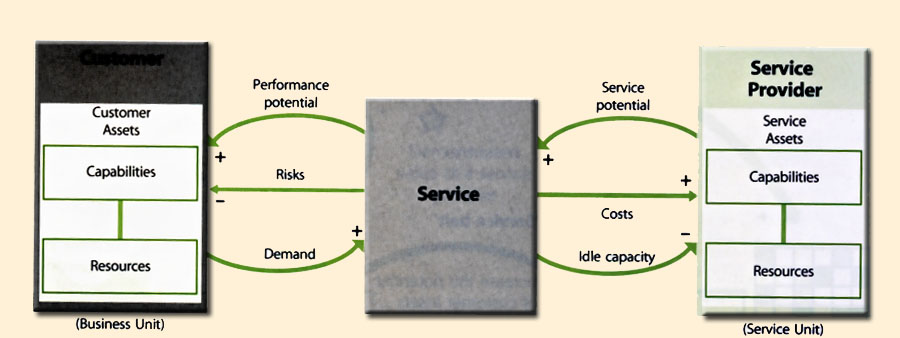
From this perspective, service management is a closedloop control system with the following functions, to:
 |
| Figure 4.17 Service management as a strategic asset and a closed-loop system |
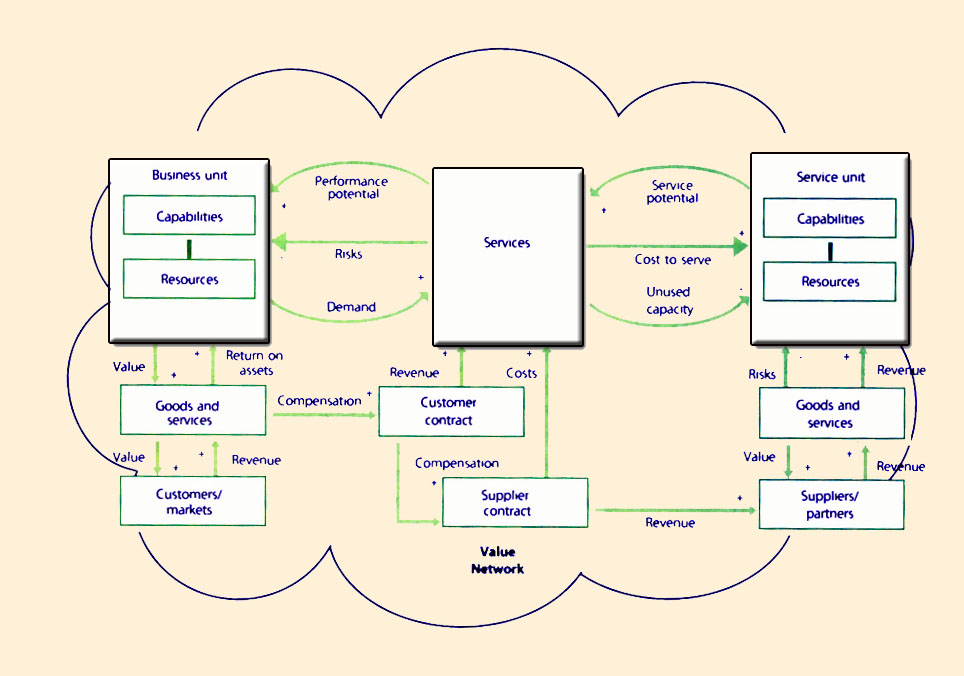
Strategic assets are dynamic in nature. They are expected to continue to perform well under changing business conditions and objectives of their organization. That requires strategic assets to have learning capabilities. Performance in the immediate future should benefit from knowledge and experience gained from the past. This requires service management to operate as a closed-loop system that systematically creates value for the customer and captures value for the service provider. An important aspect of service management is controlling the interactions between customer assets and service assets.
| Service management initiative | Increasing service potential from capabilities | Increasing service potential from resources |
| Data centre rationalization | Better control over service operations Lower complexity in infrastructure Development of infrastructure and technology assets | Increases the capacity of assets Increases economies of scale and scope Capacity building in service assets |
| Training and certification | Knowledgeable staff in control of Service Lifecycle Improved analysis and decisions | Staffing of key competencies Extension of Service Desk hours |
| Implement incident management process | Better response to service incidents Prioritization of recovery activities | Reducing losses in resource utilization |
| Develop service design process | Systematic design of services Enrichment of design portfolio | Reuse of service components Fewer service failures through design |
| Thin client computing | Increased flexibility in work locations Enhanced service continuity capabilities | Standardization and control of configurations Centralization of admin functions |
| Table 4.4 Examples of how service potential is increased | ||
Through Configuration Management, all service assets should be tagged with the name of the services to which they add service potential. This helps decisions related to service improvement and Asset Management. Clear relationships make it easier to ascertain the impact of changes, make business cases for investments in service assets, and identify opportunities for scale and scope economies. It identifies critical service assets across the Service Portfolio for a given customer or market space.
>
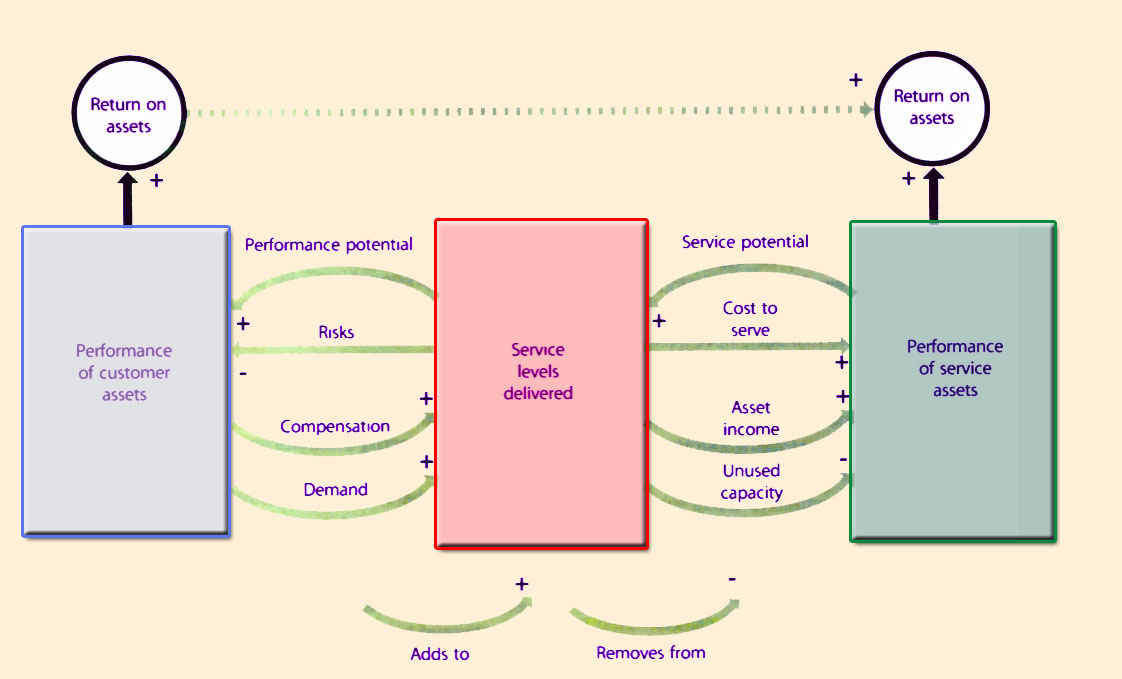 |
| Figure 4.18 Closing the loop with demand, capacity and cost to serve |
The performance potential of services is increased primarily by having the right mix of services to offer to customers, and designing those services to have an i on the customer's business. The key questions to be a are:
The productive capacity of service assets is transformed into the productive capacity of customer assets. An important aspect of delivering value for customers through services is the reduction of risks for customer deciding to utilize a service, customers are often seeking to avoid owning certain risks and costs. Therefore the performance potential of services also arises from the removal of costs and risks from the customer's businesses.
For example, a service that securely processes payments or transfer of funds for the customer reduces the risks of financial losses through error and fraud and at the same time reduces the cost per transaction by leveraging economies of scale and scope on behalf of the customer. The service provider can deploy the same set of service assets to process a large volume of transactions and free the customer from having to own and operate such assets. For certain business functions such as payroll, finance, and administration, the customer may face the financial risk of under-utilized or over-utilized assets and may therefore prefer a service offered by a Type I, Type II or a Type III service provider.
![]()
4.4 Prepare For Execution
Every model represents a kind of process. This model represents a clear and practical approach for formulating service strategies. It does not, however, guarantee success. What is needed is, through reflection and examination, to make a strategy suitable in an organization's context or situation. Strategy involves thinking as well as doing. See Figure 4.19. For senior managers accountable for investment decisions, financial- and personnel-related, the stakes are high. Strategy is critical to the performance of the organization. Service strategies must be formed and be formulated. Broad outlines are deliberate while details are allowed to emerge and adapt en route.
| Factor | Description |
| Strength and Weaknesses | The attributes of the organization. For example, resources and |
| Distinctive competencies | capabilities, service quality, operating leverage, experience, skills, cost structures, customer service, global reach, product knowledge, customer relationships and so on. As discussed throughout the chapter, 'What makes the service provider special to its business or customers?' |
| Business strategy | The perspective, position, plans and patterns received from a
business strategy. For example, a Type I and II may be
directed, as part of a new business model, to expose services
to external partners or over the internet. This is also where the discussion on customer outcomes begins and is carried forward into objectives setting. |
| Critical success factors | How will the service provider know when it is successful? |
| Threats and opportunities | When must those factors be achieved?
Includes competitive thinking. For example, 'Is the service
provider vulnerable to substitution?' Or, 'Is there a means to outperform competing alternatives?' |
| Table 4.5 Internal and external factors for a strategic assessment | |
To craft its objectives, an organization must understand what outcomes customers desire to achieve and determine how best to satisfy the important outcomes currently underserved. This is how metrics are determined for measuring how well a service is performing. The objectives for a service include three distinct types of data. These data sources are the primary means by which a service provider creates value. See Table 4.6.
There are four common categories of information frequently gathered and presented as objectives. Senior managers should understand the risk that comes with each category, if not altogether avoided:
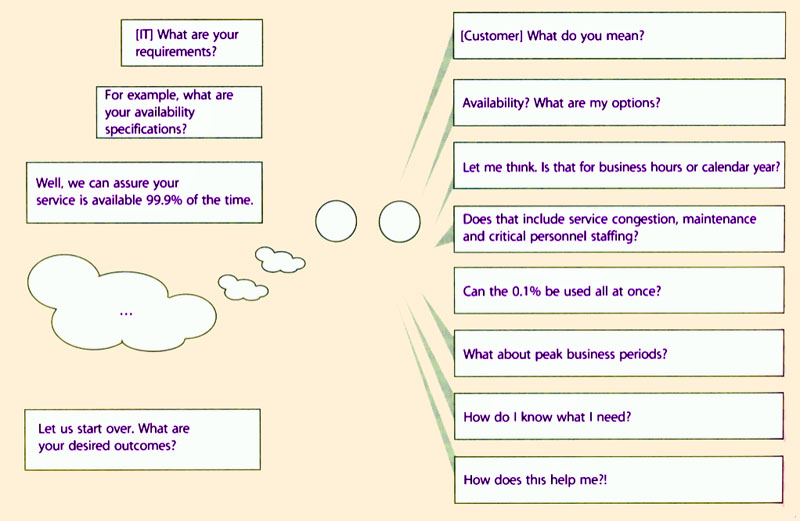
When service providers solicit requirements, customers respond in a manner and language meaningful and convenient to them. This customer-driven approach fails because it inevitably solicits the wrong inputs - the type that cannot be used to predictably ensure success. This explains the frequent disconnection between IT organizations and the businesses they serve. What the customer values is frequently different from what the organization believes it provides. Service providers should think very differently. A clear understanding of what the customer values is called a marketing mindset, compared to a manufacturing mindset. Rather than focusing inward on the production of services, look from the outside in, from the customer's view. Rather than lagging indicators, begin with the leading indicators of Table 5.3, Common business objectives. These indicators lead to a clearer understanding of service utility and service warranty, which in turn lead to defining better requirements. Customers do not buy services; they buy the satisfaction of a particular need.
| Type of Objective Data | Description |
| Customer tasks | What task or activity is the service to carry out? What job is the customer seeking to execute? |
| Customer outcomes | What outcomes is the customer attempting to obtain? What is the desired outcome? |
| Customer constraints | What constraints may prevent the customer from achieving the
desired outcome? How can the provider remove these constraints? |
| Table 4.6 Customer tasks, outcomes and constraints | |
|
| Figure 4.20 Moving from customer-driven to customer-outcomes |
This means, for example, that sales managers spend more time on-site with clients, technicians are quickly dispatched to cover equipment failures in the field, and administrative staff are consolidated at strategic locations to improve operational effectiveness. To support the customer, the service provider configures and deploys its assets in a manner that effectively supports the customer's own deployments. It may require the design, deployment, operation, and maintenance of highly available and secure messaging on wireless phones or computers. What matters is that the customer's employees are able to coordinate business activities, access business applications and control business processes.
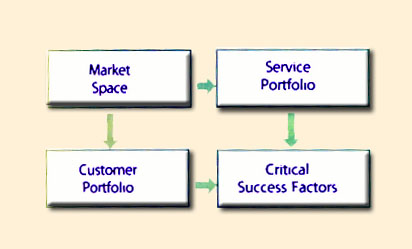 |
| Figure 4.21 Critical success factors |
For every market space there are critical success factors that determine the success or failure of a service strategy. These factors are influenced by customer needs, business trends, competition, regulatory environment, suppliers, standards, industry best practices and technologies. Critical success factors are also referred to in business literature as strategic industry factors (SIF) and have the following general characteristics:
Critical success factors by themselves are altered or influenced by one or more of the following factors:
Identifying critical success factors for a market space is an essential aspect of strategic planning and development. In each market space service providers require a core set of assets in order to support a Customer Portfolio through a Service Portfolio (Figure 4.21). For example, in the market space for high-volume real-time data processing, such as those required by the financial services industry, service providers must have large-scale computer systems, highly reliable network infrastructure, secure facilities, knowledge of industry regulations, and a very high level of contingency. Without these assets, it would not be possible for such service units to provide the utility and warranty demanded by customers in that market space.
The dynamic nature of markets, business strategies, and organizations requires critical success factors to be reviewed periodically or at significant events such as changes to Customer Portfolios, expansion into new market spaces, changes in the regulatory environment and disruptive technologies. For example, new legislation for the health care industry on the portability and privacy of patient data would alter the set of critical success factors for all service providers operating in market spaces related to health care.
The dominating success of a new market leader in search engines and online advertising may add a new critical success factor through a combination of innovative business model and technological capability. Most critical success factors are a combination of several service assets such as financial assets, experience, competencies, intellectual property, processes, infrastructure, and scale of operations.
|
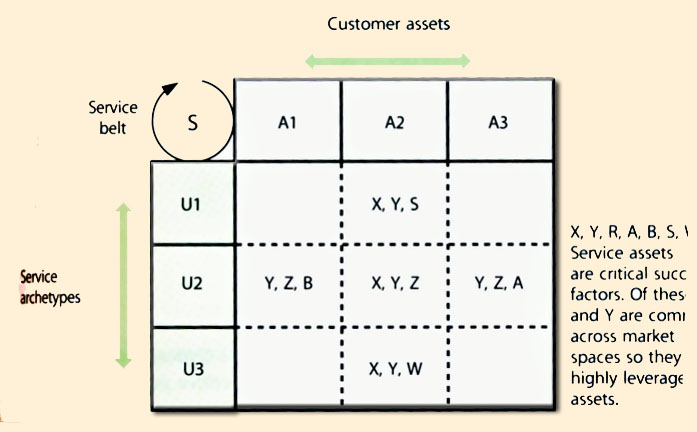
| Figure 4.22 Critical success factors leveraged across market spaces |
Critical success factors determine the service assets required to implement a service strategy successfully. For example, if a strategy requires services to be made available across a large network of locations or a wide area of coverage, the service provider must not only build capacity at key locations. The provider must also operate the network as a system of nodes so that the cost of serving all customers is roughly identical to and within a price point consistent with a strategic position in a market space. Not all critical success factors need favour large organizations or economy of scale in operations. Some strategies favour organizations small in size but highly competitive through the knowledge they have of customers and related market spaces. Managers must therefore conduct evaluation exercises to ascertain the critical success factors in force.
One way to define critical success factors is by customer assets and the service archetypes (Figure 4.22). For example, in health care, IT Service Providers have extensive knowledge of hospital procedures, medical equipment, interactions between physicians, clinicians and pharmacists, insurance policies and privacy regulations. Service providers present in market spaces related to the quality of outcomes in health care typically have physicians and clinicians on their payroll. Service strategies for the health care market spaces take into account the need to deal with users with highly specialized skills, special purpose equipment, low tolerance for error, and the need to balance security with usability of services. These are critical success factors for a cluster of market spaces related to health care. A subset of these critical success factors is shared by other market spaces such as military applications. Critical success factors can therefore span more than one market space. They represent opportunities for leveraging economies of scale and scope.
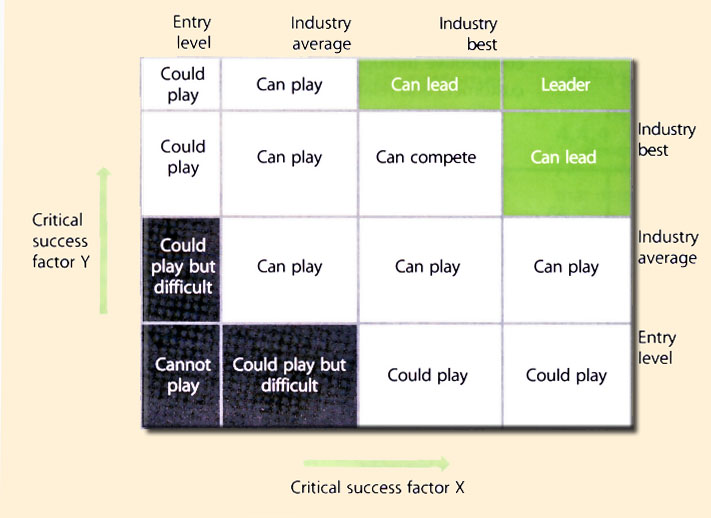
Conduct a strategic analysis for every market space, customer and Service Portfolio to determine current strategic positions and desired strategic positions for success. This analysis requires service providers to gather data from customer surveys, service level reviews, industry benchmarks, and competitive analysis conducted by the parties or internal research teams. Each critical success. factor is measured on a meaningful index or scale. It is best to adopt indices and scales that are commonly used within a market space or industry to facilitate benchmarking and comparative analysis. Critical success factors are used to define playing fields, which serve as reference frameworks for evaluation of strategic position and competitive scenarios (Figure 4.23).
|
| Figure 4.23 Critical success fact and competitive positions in playing fields |
These benchmarks are relative (not absolute) and their values on an index may vary over time. For example, the initial entry-level benchmark for cost as a CSF may be quite easy to cross in a new market space with low levels of competition. The benchmark may become higher (lower costs) because of competitive action combined with technology innovations or other factors, such as excessive supply of resources in the market space (as happened a few years ago with telecommunications bandwidth). Strategic analysis should take into account not only the current benchmarks for a playing field but also the direction in which they are expected to move (higher or lower), the magnitude of change, and the related probabilities.
This analysis is necessary for service providers to avoid being surprised by changes in the market space that can completely destroy their value proposition. Type I service providers may be particularly vulnerable to such blind spots if they are not accustomed to the business analysis found in Type II and Type III providers. Type I providers also face competition even if they have captive customers within their enterprise. The playing field is used to conduct strategic analysis of Market Spaces, Customer Portfolios (Figure 4.24), Service Portfolios, and Contract Portfolios. Managers decide the required scenarios to construct using applicable CSFs, scales and indices.
 |
| Figure 4.24 Strategic analysis of Customer Portfolio |
|
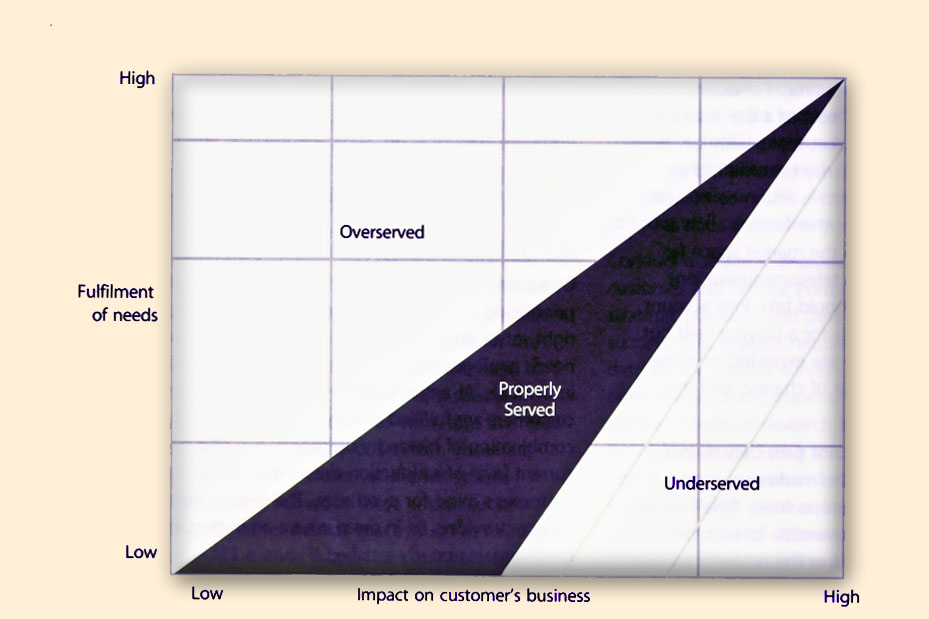
| Figure 4.25 Prioritizing strategic investments based on customer needs |
Begin with a broad set of outcomes such as business asset productivity. This defines a broad market space. Lost business asset productivity is linked with how it is recovered through services. Unserved and underserved customer needs are identified within this context and focus is applied based on existing strengths and opportunities. This defines narrower market spaces with specialization based on the categories of business assets and the manner in which they are supported by services (service archetypes).
Providers decide which customer needs are effectively and efficiently served through services, while choosing to serve certain market spaces and avoid others. This essential aspect of service strategy is broken down into the following decisions. Firstly, identify:
| Market space analysis for Type I and Type II providers follows similar principles to those for Type III. Differences are in terms of the extent to which decisions are influenced by:
|
| Understand the mutual relationship between customers and market spaces. Customers can contain one or more market spaces. Market spaces can contain one or more customers (Figure 4.27).
|
|
|
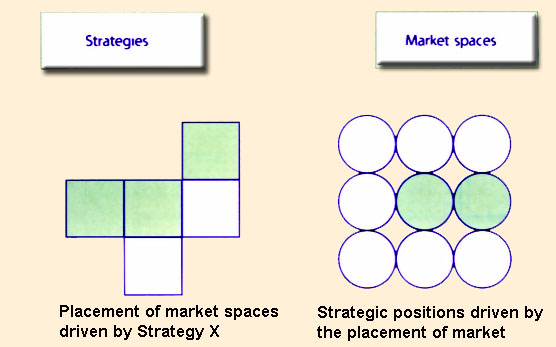
| Figure 4.28 Strategies and market spaces |
The business strategy of a service provider usually determines the placement of market spaces. However, the placement of market spaces also influences the type of strategies to be pursued. This mutual influence will lead to adjustments and changes over any given planning horizon (Figure 4.28). Since market spaces are defined based on outcomes desired by customers, the changes and adjustments are ultimately based on the dynamics of the customer's business environment. Over time there will be cohesiveness between strategies and market spaces from mutual alignment and reinforcement.
Since market spaces are defined in terms of the business needs of customers, service provider strategies are therefore aligned to customers. This is the most important reason why service providers must think in terms of market spaces and not simply industry sectors, geographies, or technology platforms. This is intuitive to the senior leadership of Type I providers because they are accustomed to being driven more by the outcomes expected by their business units than by the traditional segmentation of markets.

|
| Figure 4.29 Expansion into adjacent market spaces |
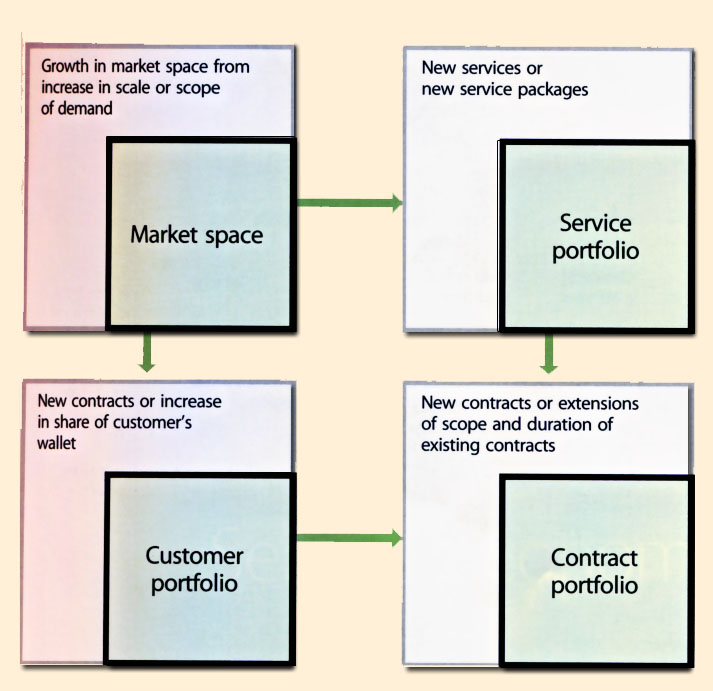
Contracts represent combinations of customers and services. Contracts exist where there are commitments to . customer with respect to a service. Service agreements are types of contracts. It follows that Contract Portfolios are based on the interaction of the Customer Portfolio and the Service Portfolio. Changes to the Contract Portfolio are driven by changes to either the Customer Portfolio or the Service Portfolio (Figure 4.30). Growth in a market space is achieved by:
In any given market space there are critical success factors that determine whether or not a service provider is competitive in offering services. These factors are defined in terms of the relative importance of a set of outcomes or benefits as perceived by customers. Examples are affordability, number of service channels or delivery platforms, lead times to activate new accounts, and the availability of services in areas where customers have business operations (Figure 4.31).
|
| Figure 4.30 Growth in a market space |
|
Appropriate indices or scales are necessary. A value curve can then be plotted by linking the performance on each scale or index corresponding to a critical success factor." Market research can determine the value curve that represents the average industry performance or one that represents key competitors. Feedback obtained from customers through periodic reviews or satisfaction are used to plot your own value curve in a given market space or for your Customer Portfolio. Service strategies should then seek to create a separation between the value curves, which are nothing but differentiation in the market space. The greater the differentiation, the more distinctive the value proposition offered in your services as perceived by customers. The differentiation is normally created through better a better mix of services, superior service designs, and operational effectiveness that allows for efficiency and effectiveness in the delivery and support of services. Through various combinations of factors there are many ways in which to create differentiation. service management is about making decisions on the service design, transition, operation, and improvement that lead to differentiation in every supported market space. Again, this is just as applicable to Type I providers. It is a good practice to periodically review the competitive position of every service in the corresponding market space. This is particularly important in relation to shifts in business trends or major changes in the business environment that may alter the economics behind the customer's decision to source a service. |
Supporting Material |
|
|
